Screenshots:
Description:
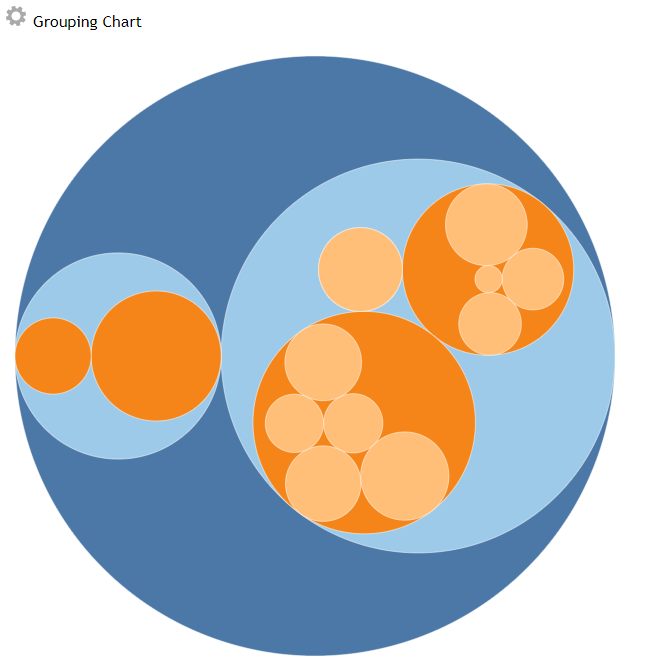
Grouping Chart Excel Add-in is a tool to visualize hierarchical relationships data into circle groups.
Features:
- Sample Data: Sample data can be the template to build your own data.
- Easy to use and user friendly: The Add-in can be used with few easy setting changes.
- Resizable: The user can resize the graph by dragging the frame of the add-in.
- Tool-tips: Mouse over the chart to view the data detail in the tool-tips.
- Customizable Title: Change the title by clicking the title area and enter the text as needed.
- Interactive Chart: the chart is binding to the data table in the sheet. The chart is updating when the data is entered.
Steps:
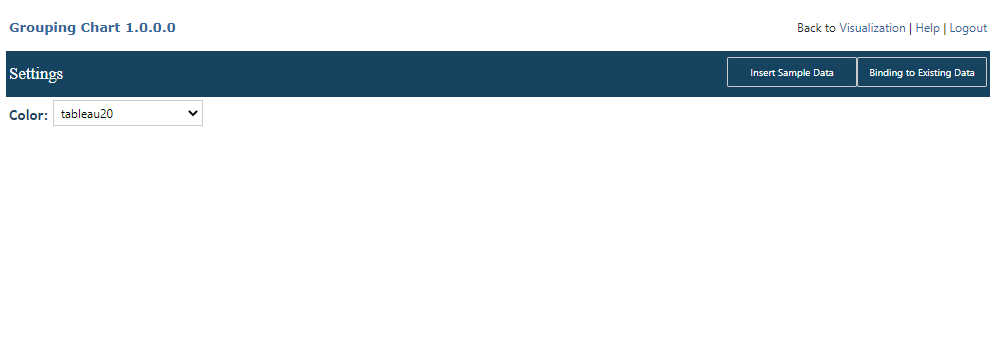
- In setting window, Select a sample data type.
- Click Insert Sample Data button.
- The graph is shown in the visualization screen.
- Build your own data by following the sample data format. More data series can be added in the order in the Data Format
- Click the Binding to Existing data to draw your data.
Data Format:
| Field | Data Type | Description |
|---|---|---|
| id | number | id: sequence number. |
| name | string | item name. |
| parent | number | parent id. |
| size | number | The value of the data series. |
Instruction:
1.0.0.0 Release Notes