Screenshots:


Description:
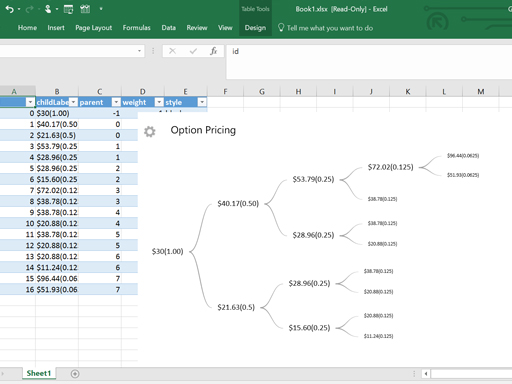
Decision Tree Excel Add-in visualizes a course of actions, statistical probability outcomes or option pricing in a binary tree graph.
Features:
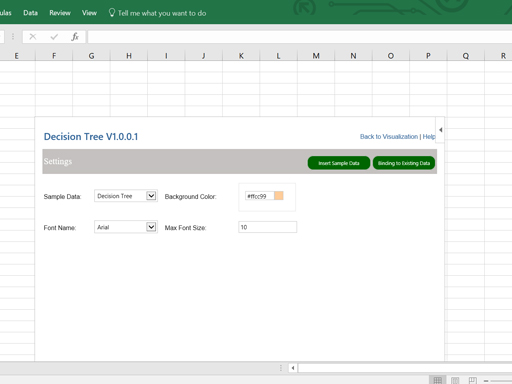
- User can select different fonts in the setting window for the tree labels.
- Adjustable node size of the tree by using the max font size setting.
- Easy to use and user friendly. Sample data can be the template to build own data.
- Chart Title can be changed by click at the title and enter the new title and click out out the box to save it.
- Interactive Chart: the chart is binding to the data table in the sheet, the map is updating when the data is entering the sheet.
Steps:
- In setting window, Select a sample data type
- Click Insert Sample Data button.
- The graph is shown in visualization screen.
- Build your own data by following the sample data format.
- Click the Binding to Existing data to draw your data.
Data Format:
Two sample data in the add-in helps user to understand the data structures:
- Decision Tree Sample Data.
- Option Pricing model sample data.
Both sample data have the same format.
| Field | Data Type | Description |
|---|---|---|
| ID | Number | identifier of the node. |
| Label | string | the label of the node in the tree. |
| ParentID | Number | the parent node id in the tree. |
| Size | Number | the font size of the node. It is a relative representation of the font size, not the real font size. |
| Style | Number | the color of the node. It can be a text such as "black", "red", "green" or a color code such as #FF0000, #00FF00. |
Instruction:
Version 1.0.0.1 Release Notes:
- Add resizing feature by dragging the add-in window edge and remove manual width and height setting.
- Add background color setting.
1.0.1.0 Release Notes
GCC Office Add-ins 1.0.1.0 incorporates Micrsoft SaaS and Security model and integrates all GCC Office Add-ins into one entry screen. By subscribing GCC SaaS Offer, user can use 20+ GCC Office Add-ins for data visualize.